
DATA & INSIGHTS
Your employee relations data, finally telling you something






















From case files to early warning system
Most ER data dies in closed cases. AllVoices keeps it working: surfacing patterns, tracking performance, and answering the questions leadership actually asks.

ASK VERA ANYTHING
Plain-language questions, instant charts
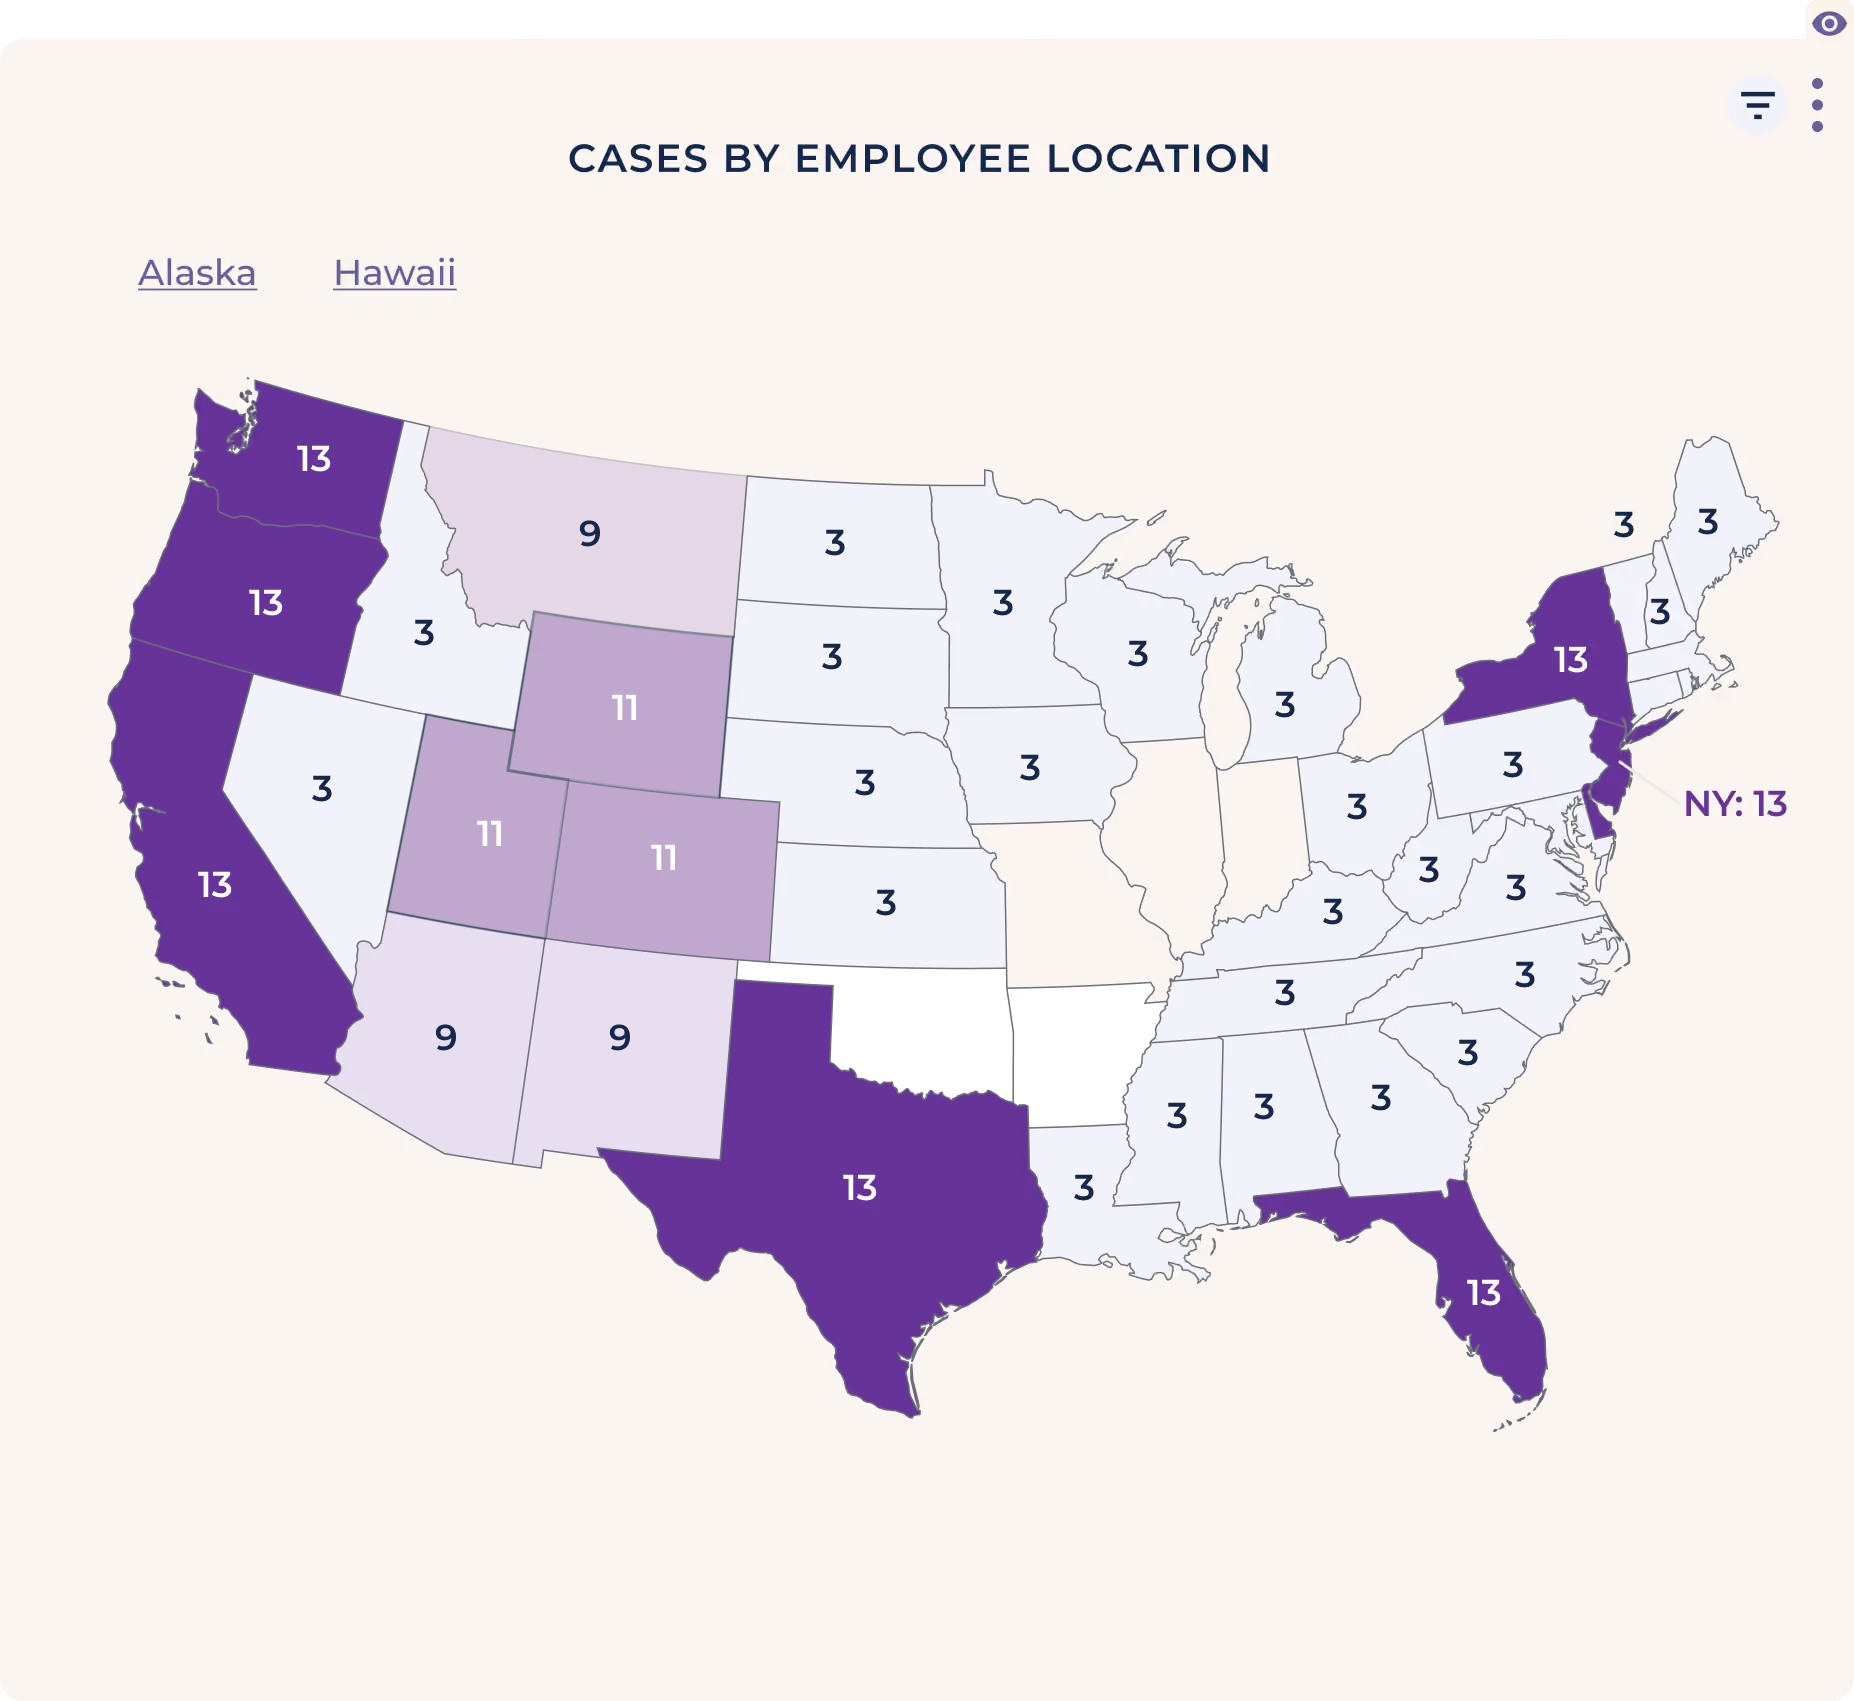
Ask about SLA performance, case volume by location, or issue types trending up. Vera answers immediately, builds the chart, and pins it to your dashboard. The analyst bottleneck is gone.

TREND DETECTION
See the pattern before it becomes the problem
Repeat subjects, rising report volume in one location, accommodation requests spiking in one department: structured case data makes patterns visible while there's still time to act on them.

SCHEDULED REPORTING
The leadership report that builds itself
Dashboards and scheduled reports keep leadership, legal, and the board current without your team assembling decks. The numbers update because the work updates them.

YOUR DATA, YOUR TOOLS
Your tools, process, and customizations
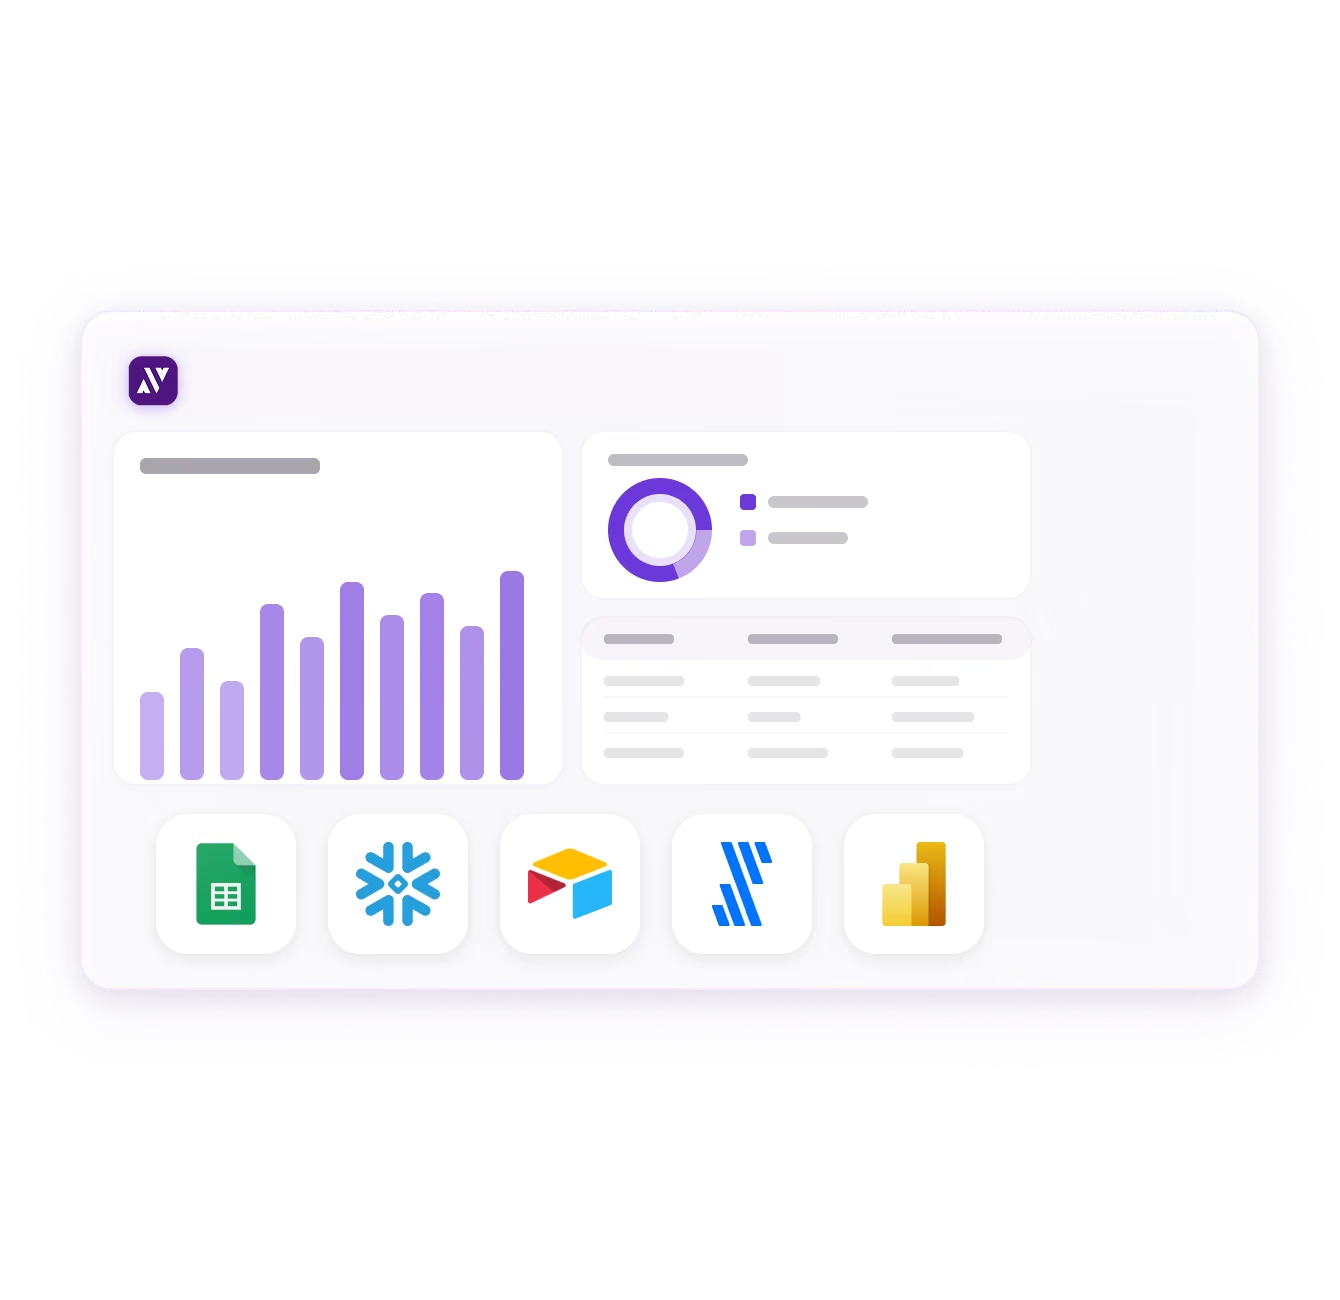
Analyze inside AllVoices or send case data to your BI stack for deeper modeling alongside the rest of your people data. Your data team chooses where analysis happens.

Good analytics start at intake, not at export
Dashboards built on messy data lie. AllVoices data is clean because the platform structures it the moment work happens.


Employee relations insights that your team will understand


Bring in all of your data to get the best outcomes
Employee relations analytics, compared
 |
Spreadsheet reporting | BI tools alone | |
|---|---|---|---|
| Data quality | Structured at intake, clean by default | As consistent as the last person's typing | Only as good as what gets exported in |
| Getting an answer | Ask Vera, get the chart in seconds | An afternoon of filters and pivot tables | A ticket to the data team |
| Trend detection | Patterns across every channel, surfaced early | Whatever someone happens to notice | Possible, if someone builds the model |
| Leadership reporting | Dashboards and scheduled reports, automatic | A deck rebuilt every month by hand | Powerful, but always a project |
| Who can use it | Anyone who can type a question | Whoever owns the spreadsheet | Analysts |
| Works with your BI stack | Yes, push to Power BI, Snowflake, Tableau | Manual exports | That's the stack itself |
What’s shared in AllVoices stays in AllVoices







Yes. AES-256 encryption, role-based access, zero AI training on your data. SOC 2 Type 2, GDPR, and CCPA compliant.
Role-based access controls govern dashboards and reports just like cases, so sensitive aggregate views stay with the right audience.
Structured data across every channel makes patterns queryable: rising volume by location, repeat subjects, issue types accelerating quarter over quarter. Your team sees the pattern while it's still a pattern, not a crisis.
Yes. Push case data to Power BI, Snowflake, or Tableau to analyze alongside the rest of your people data.
Yes. Vera generates custom charts on demand and pins them to dashboards, and scheduled reports keep stakeholders current automatically.
Yes, that's the point. Ask Vera a question in plain language and get the answer with a chart. No query language, no waiting on a data team.
Case volume and types, time to resolution, SLA performance, outcomes, repeat subjects, and trend lines by org unit. AllVoices tracks these automatically because cases are structured from intake.
The analysis of case, report, and survey data to understand workplace risk and team performance: trends by location, issue type, manager, and time. AllVoices builds this in, with Vera generating charts from plain-language questions.